Hi Team,
Today i am going to share one of the nightmarish issue with you all, We are having Sitecore 9.1.1 hosted in azure PaaS environment
Our site was working just fine and no noise, but we have been working on a feature release where 7-8 months of development needed to be released to production, Big GO LIVE event right?
Also to make the development smoother we also introduced BLUE/GREEN deployment slots in the same release, so we can easily SWAP slots and go live
Everything went well, we went live, we even did load and performance testing on our staging and pre-prod and we were confident enough of results
Very next day we started getting "SITE DOWN" alerts, and also product owners and clients mentioned that site is very slow for them in US time and in our morning when we were accessing it, it was working lighting fast so we were clue less at start, but we started digging
1) First thing caught our eyes were HIGH CPU spikes, in US time, also without any traffic CPU used to spike to 100% and it never used to come down until we restart the azure app (see below it used to stick to 100% for hours)
2) There was nothing helpful in the logs, apart from couple of exceptions but we resolved them and still CPUs were high
3) Nothing helpful in application insights too
4) All the roles like processing, reporting, xDB, refdata were looking just ok and no CPU spikes there, We observed that "pools db" was having high DTU, but after re indexing the index, it also came down but CD CPUs were still high
5) We tried up scaling the plan from S3 to P2V2 also we increase REDIS CACHE from C1 to C2 to try our luck, but NO, CPUs were never coming down
5) Because we were in azure PaaS, We enabled proactive CPU monitoring to make sure when CPU goes above 95% for a minute, It should take the dump (*.dmp)
6) We got couple of dumps, and most of the top 5 calls were showing one specific component that we have on the page
7) Another analysis we got was CPU spikes are only happening after we went live, before that it was stable, and with our surprise that component was reusable and it has variants of different kind, and it was already present on other pages but it was not having any issues there
8) So, now we started to find the difference between what is the difference in presentation detail of those pages and our new pages and there was nothing eyebrow raising apart from few different components
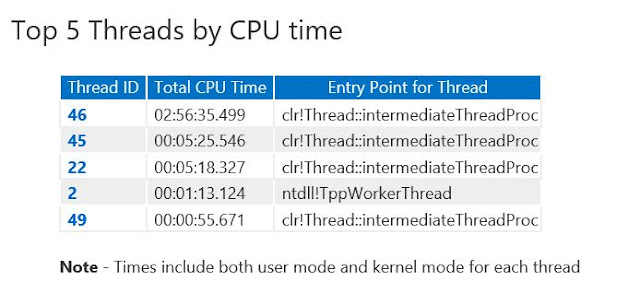
9) We again got back to our dump which were taken when CPU was high, we had couple of dumps and it was pointing us to one common rendering which we have used, following is a quick snapshot of our dump
TOP 5 Threads by CPU time
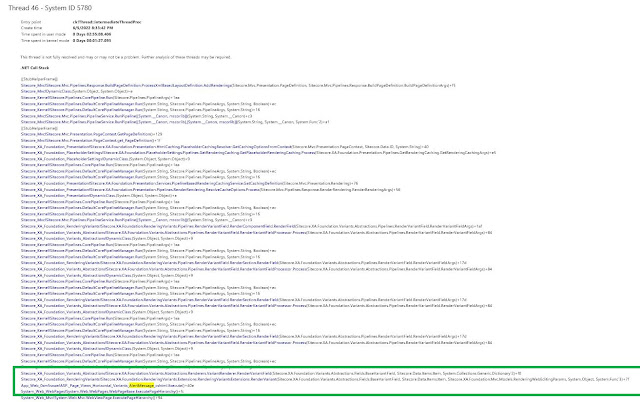
Now it time to look into these threads, so Thread 46 and 45 were pointing to our problematic rendering , In below table dump is showing the problematic page and on this page we had that rendering which was causing issue.
Upon inspecting further to see what this thread is executing, we saw our culprit
and all the dumps were showing these new pages only with which we went live, with our surprise these renderings were already being used on other page but no issues there, so we concentrated to look into this component in detail
10) So now our issue was because our new pages were using these rendering excessively, we plan to remove them from our stage environment as issue was there too, so we renamed the placeholder keys in presentation details so these do not get rendered and with our surprise, next day CPUs were absolutely normal, So it was our first success in identifying that issue is with any specific variant of this rendering, because rendering did not have any issues, any particular variant had some issues
11) So we started looking at one by one variant their data sources to see if there is any specific operation being done which is causing this? in that process one rendering caught our eyes which had used "component" field in the variant like below
12) Now we used "component" field which is calling one more controller rendering from inside of it, so first thing i did was, i commented the complete back-end code i.e i commented everything inside that action method and returned empty result, so that if any back-end code is doing anything we can get rid of it and CPU should come down, but with my surprise CPUs were still high :(
13) But if we remove that rendering item completely from component field's reference, it was working fine, which was even more disheartening, because now its not our code but something else in sitecore doing this and making CPU high
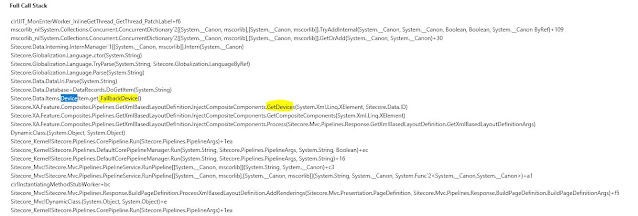
14) Believe me till now we were clueless and were thinking to remove this component and use something else, but we thought to revisit our DUMP to see if we get any other hints and what we got was below
Well, we were observing device specific code getting executed too, so we also tried disabling device detection but no luck with rendering enabled nothing worked
15) Because it was showing devices, we tried to browse the site from mobile and suddenly it caught our eyes that those pages which had this rendering variant were not opening in mobile device and they were giving 504 bad gateway error page.
Well, At this point of time we were 100% sure that these things are related, so finally after lot of dump analysis and research we found below
Finally the solution
Now, we had 100% scenarios that when someone visits pages with that rendering variant from mobile CPU was spiking up, and that rendering variant was only available after post login, and our team mate Akshay Barve pointed to one of the KBs titled "Illegal recursion detected", with our surprise it clearly mentioned below
"SXA website pages might fail to load with a high CPU usage and an unhandled exception if the page is requested with a mobile device or in the mobile mode of a desktop browser. The root cause of the issue is an infinite recursion on page load when using a component variant field for a mobile device"
Strangely we were not getting these logs otherwise we could have captured it in initial findings, we tried this patch and it worked like a charm and our nightmare was over, after this fix CPUs just slept and were able to take large number of requests and was able to hold huge traffic.
But in this troubleshooting journey we did so much of other things, we got rid of exceptions which we were coming, we touched performance parts for which i am going to write one blog post of what all we did, so its all learning...
Hope some of you will find this helpful and get early help if this weird behavior happens !!!
Many thanks to Muktesh Mehta and Kiran Patil for helping on this troubleshooting and taking out time from their busy schedule, and providing valuable inputs, Much appreciated !!!


This comment has been removed by the author.
ReplyDeleteI don't have any knowledge on sitecore, but I like the way it was investigated and summarize in story telling mode.
ReplyDeleteKudos to Daivagna for your efforts and sharing it.
Thank you buddy !!!
Delete